
Calculated fields, Parameters, Drill Down, Set Actions, Functions, Formats
Introduction
Below are various tips and tricks for creating visualizations in Tableau. These tips may be useful if you are looking for:
- How to create a date filter slider that is set to the maximum number of days (including today’s date) each time you open a workbook
- How to create a clickable dropdown of categories and their subcategories
- How to quickly resize time frames for the datetime bins used on charts
- How to return only the last value of a categorical variable instead of all available values
- How to exclude certain values from view without filtering them
- How to hide zero values in charts
I. Create a parameter with the max. number of days set when the workbook opens
- What could it be useful for?
To load all data up to today’s date into the charts when the workbook opens, using the parameter with the max. number of days specified as a filter that’s controlled by a slider.

1.) Create a calculated field that returns the difference between the selected datetime field and today’s date as an integer.
Name: Shipment Created At DateDiff INT
INT(DATEDIFF('day', [Created At (Shipment)], TODAY()))
2.) Create a calculated field that returns the maximum number (for the oldest date) for the calculated field from the previous step, regardless of any filters, using the FIXED function for this purpose.
Name: Shipment Created At DateDiff INT FIX
{FIXED :MAX([Shipment Created At DateDiff INT])}
3.) Create a calculated field that returns the maximum day difference between the date field from the database and today’s date.
Name: Shipment Created At DateDiff INT MAX
IF [Shipment Created At DateDiff INT] = {FIXED : MIN([Shipment Created At DateDiff INT])} THEN
    0
ELSE
    {FIXED :MAX([Shipment Created At DateDiff INT])}
END
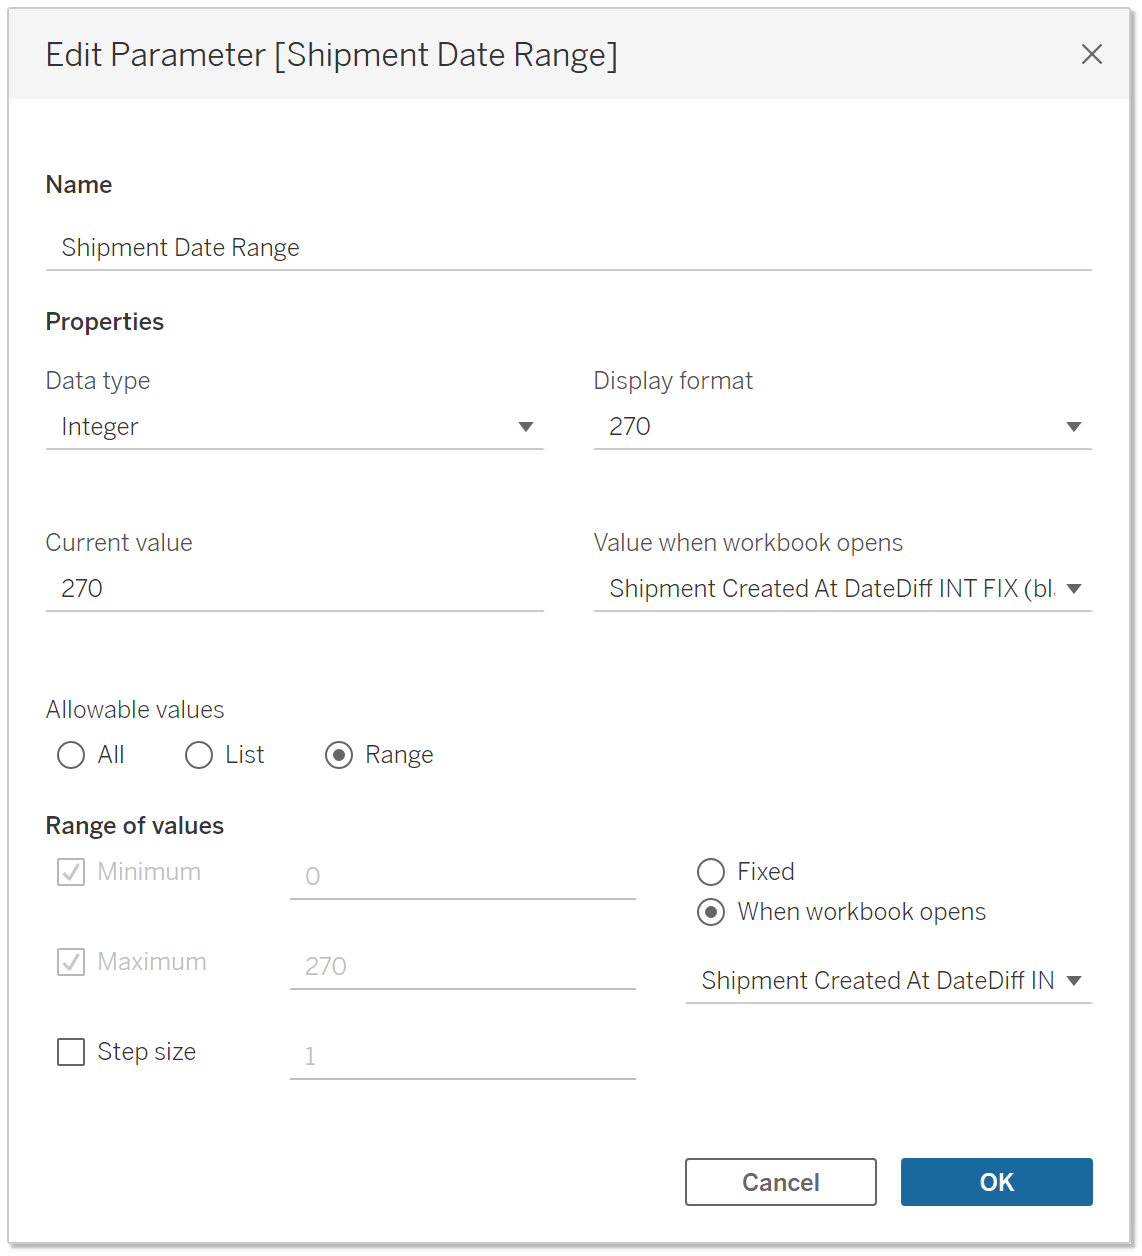
4.) Create a parameter, where for properties use the field created from step 2. and for а range of values use the field created from step 3.
Name: Shipment Date Range
5.) Create a calculated field as a Boolean type which checks that the date difference for the selected datetime field and today’s date is not higher than the number of days from the created parameter.
Name: Shipment Date Range Filter
DATEDIFF('day', [Created At (Shipment)],Today()) <= [Shipment Date Range]
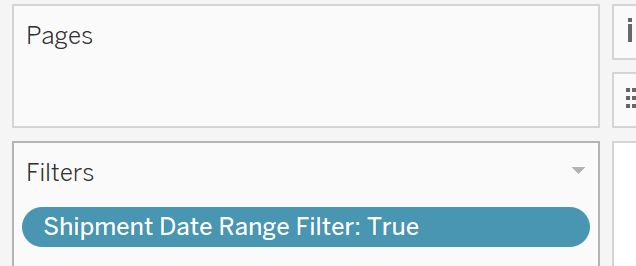
6.) Place the created field from step 5. to all worksheets where you need such a filter and choose True.
7.) Show the created parameter on the dashboard layout.

Now whenever the workbook is opened the filter is set to the maximum days for the selected datetime field from the database and is easy to control by slider.
II. Create a Drill Down using Set Actions
- What could it be useful for?
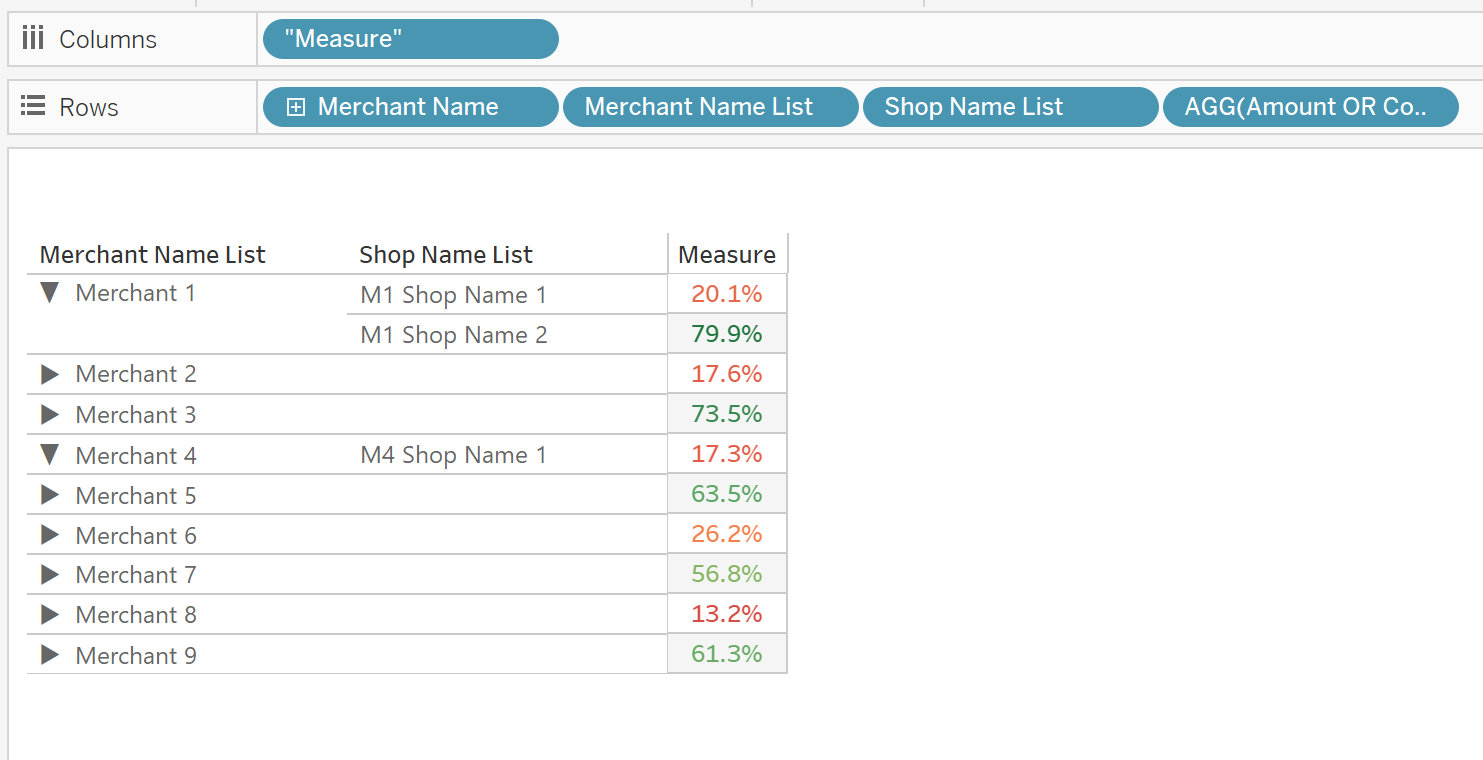
To be able to show all the Sub-Categories by clicking the corresponding Category. And if the Category isn’t selected then it stays collapsed. See the example below, Merchant Name as Category and Shop Name as Sub-Categories.
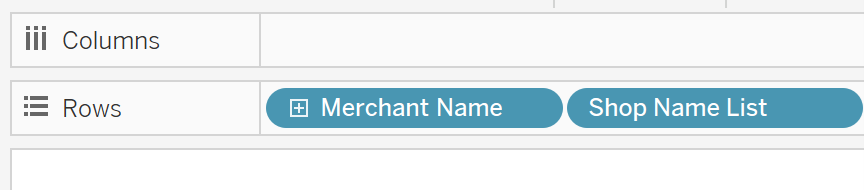
1.) Place Category onto the Rows

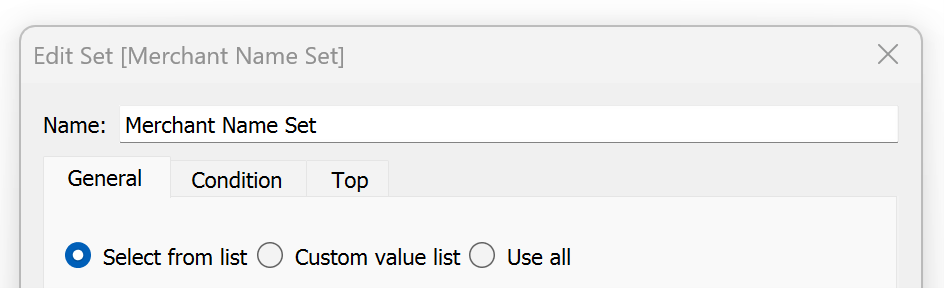
2.) Create a Set from the Category field

3.) Create a calculated field as “Sub-Category List” and place this onto the Rows
Name: Shop Name List
IF [Merchant Name Set] THEN [Shop Name]
ELSE "" END
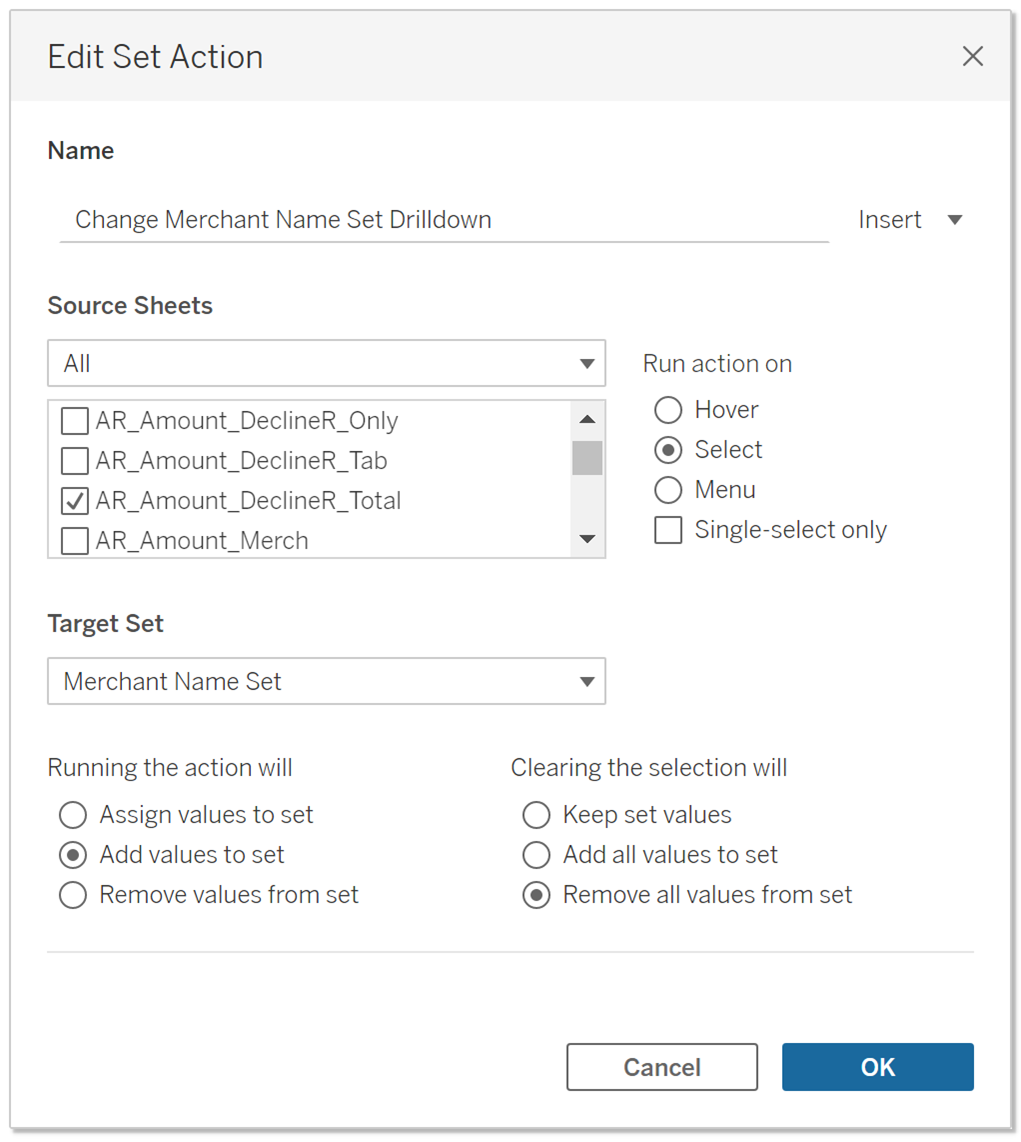
4.) Create a Set Action by going to ‘Worksheet’ at the top left of Tableau and clicking on ‘Actions…’. Next click on ‘Add Actions’ in the new window that pops up

5.) Name this Set Action as ‘Change Category Set Drilldown’, as a target set choose Category Set from the previous steps and make sure you have ‘Remove all values from set’ selected at the bottom right of this window.
6.) Create another calculated field called ‘Category List’ and place this field onto the Rows
Name: Merchant Name List
IF [Merchant Name Set] THEN '▼   '
ELSE '▶   '
END + [Merchant Name]
7.) Ensure that the Category is to the left of ‘Category List’ in the Rows. Then right-click on Category and click on ‘Show Header’ to hide it from the view.

This way you will be able to both drill up and down without the order of Category changing.
III. Creating a parameter to resize time frames for datetime bins
- What could it be useful for?
A user-friendly and quick way to resize time frames for datetime bins, e.g. day, week, month, quarter, etc.
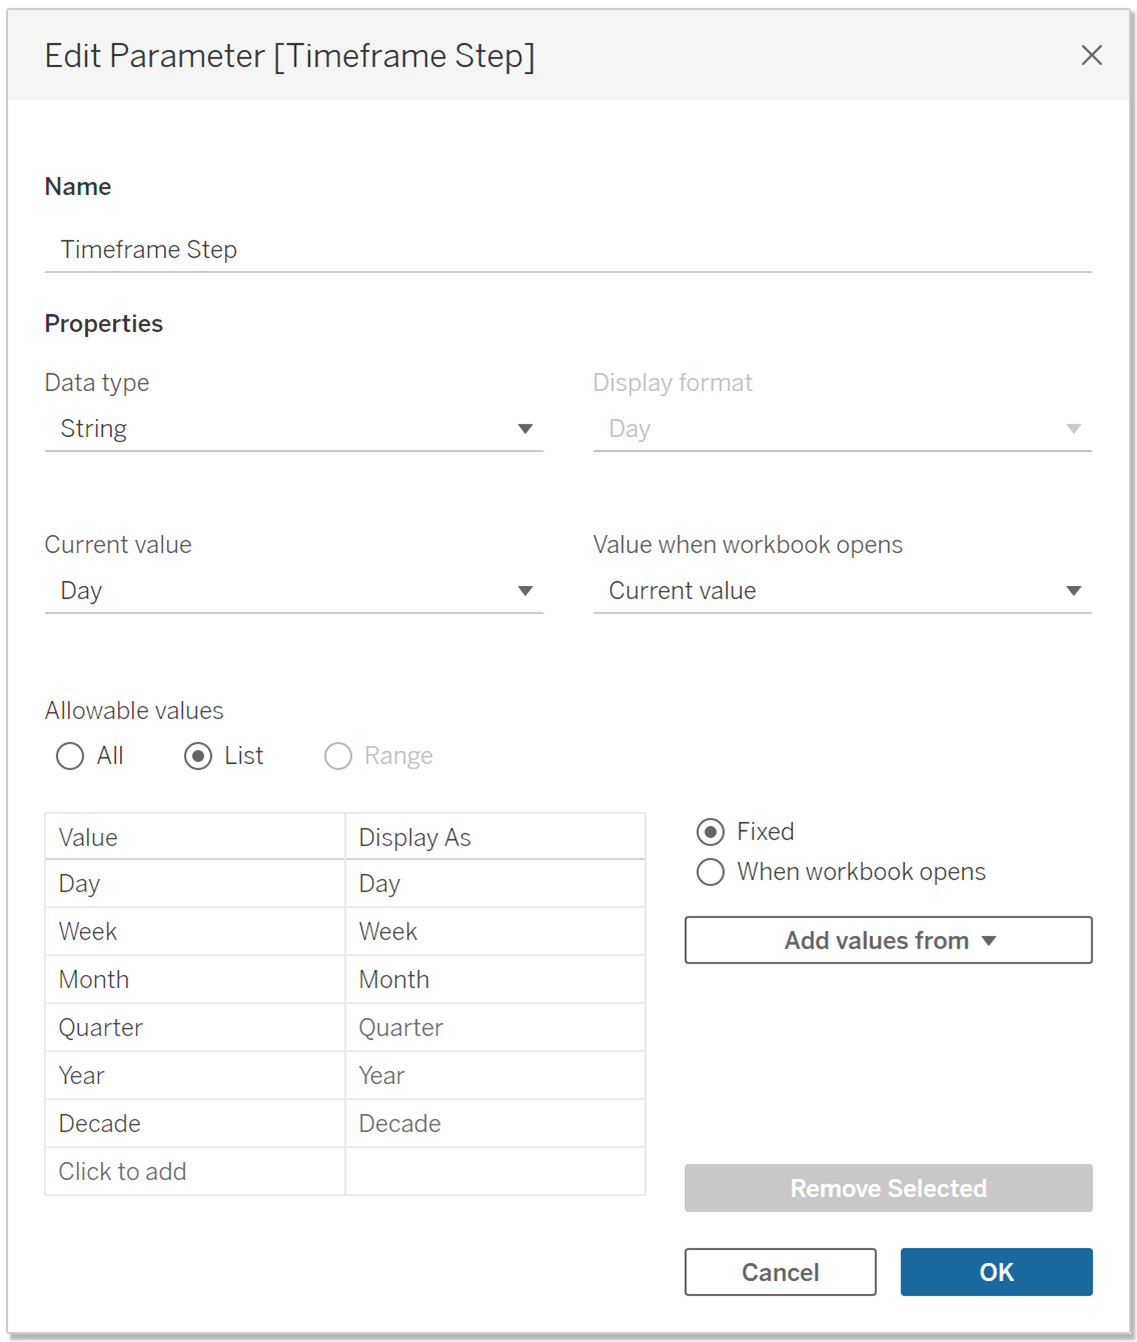
1.) Create a new parameter with a string data type, allowable values defined as a list with required values, starting from minute, hour, or day, depending on the purpose. See the settings below.
Name: Timeframe Step
2.) Choose the date time field from the database to which the parameter will be applied
3.) For the chosen field create a calculated field that would apply the DATETRUNC() function on different levels, e.g. day/week/month/etc., depending on the current value of the parameter.
Name: Order Created TimeFrame
CASE [Timeframe Step]
WHEN "Day" THEN DATETRUNC('day', [Order Created At])
WHEN "Week" THEN DATETRUNC('week', [Order Created At])
WHEN "Month" THEN DATETRUNC('month', [Order Created At])
WHEN "Quarter" THEN DATETRUNC('quarter', [Order Created At])
WHEN "Year" THEN DATETRUNC('year', [Order Created At])
WHEN "Decade" THEN DATETRUNC('year', DATEADD('year', -YEAR([Order Created At])%10, [Order Created At]))
END
Since decade isn’t defined in the default Tableau’s DATETRUNC function, an additional workaround was required, using the DATEADD function as stated above.
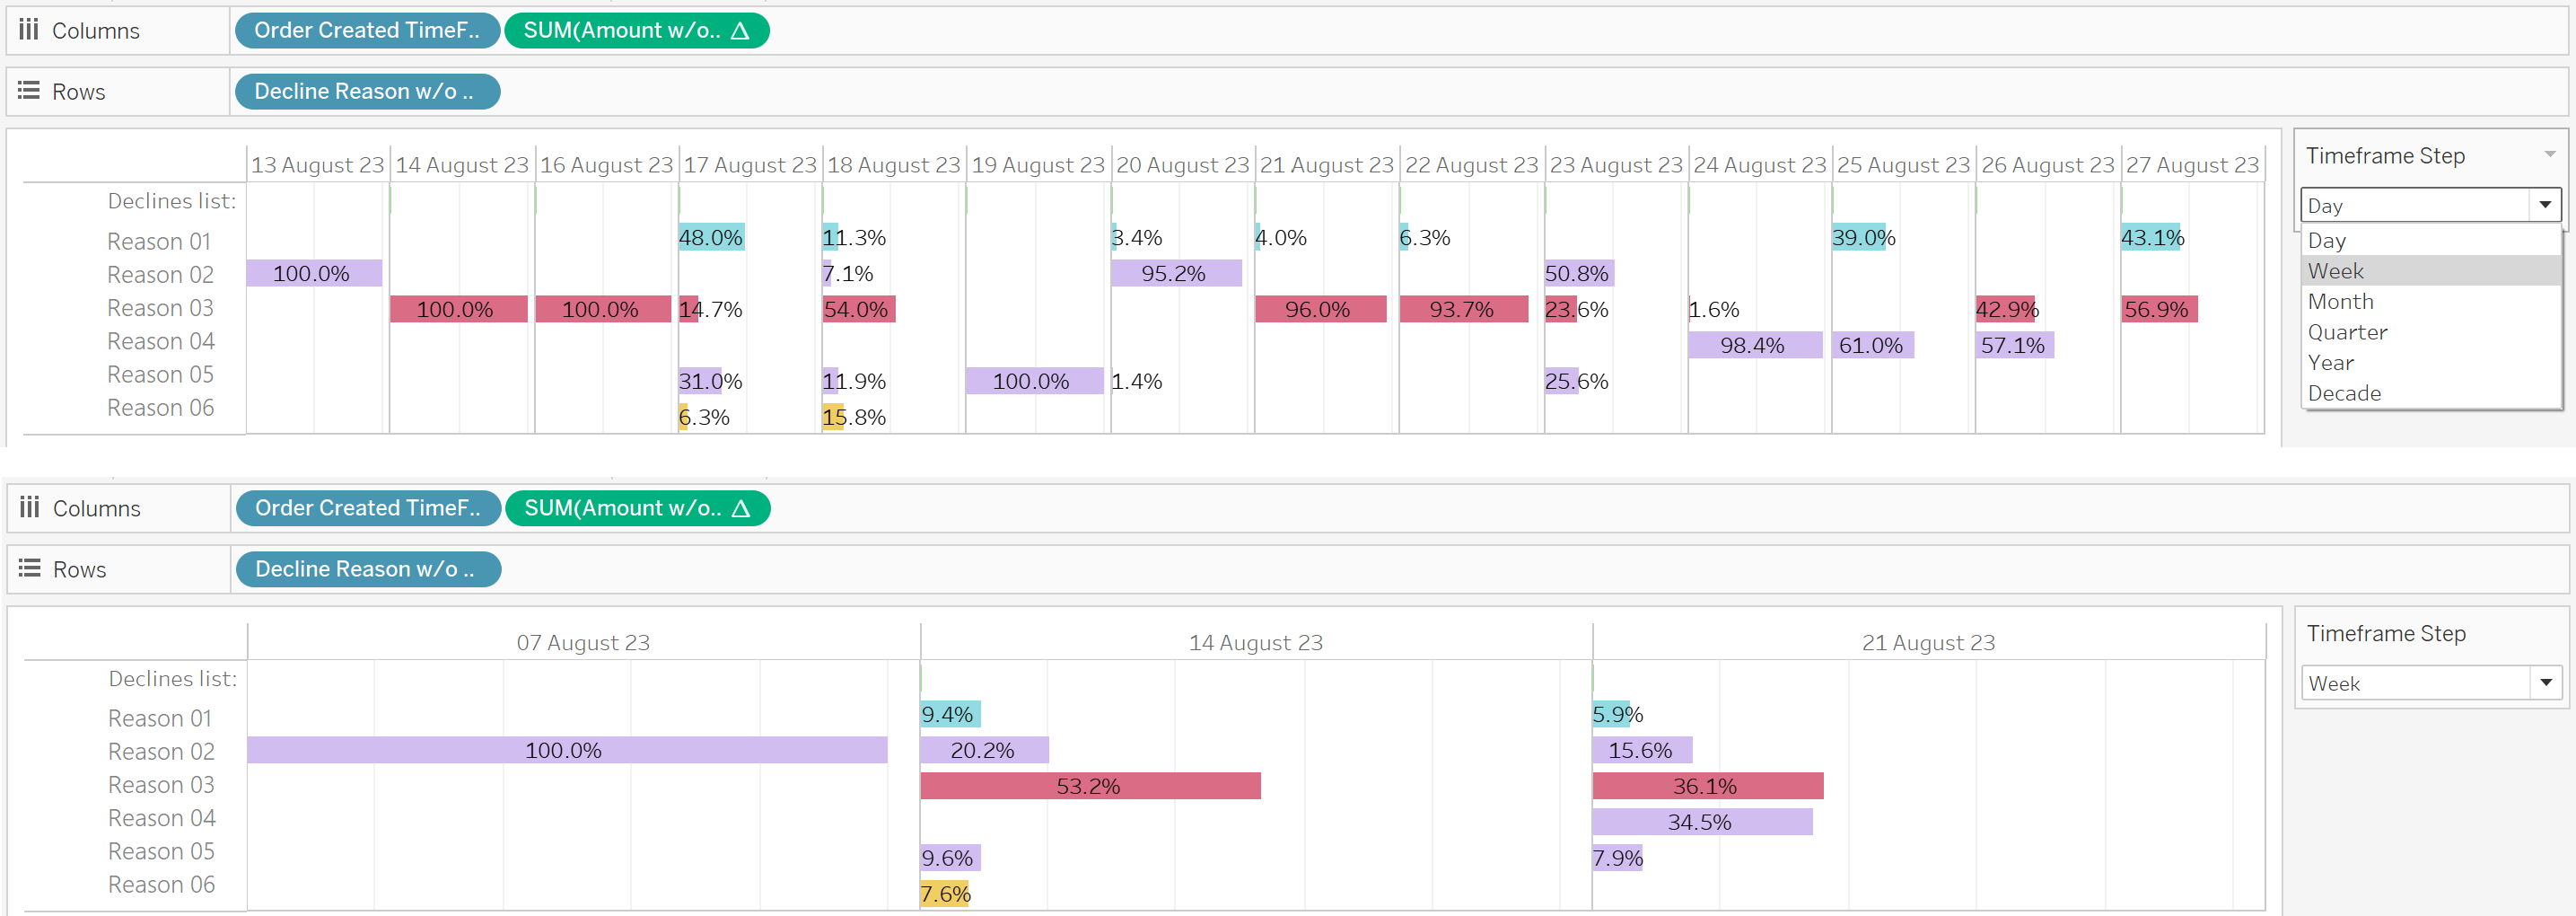
4.) Place the created calculated field from step 3. to Columns, then right-click to this pill and choose Exact Date, then right-click again and choose discrete.
5.) Right-click on the parameter from the parameters list and choose Show Parameter.
Now it’s possible to resize datetime bins quickly from the parameter timeframe dropdown menu.
IV. Create a calculated field to return the latest categorical value
- What could it be useful for?
If the database has a category field that contains different values e.g. for each consumer (such as the consumer’s status), which may change over time, then this calculation can be used to return the status that the consumer most recently received.
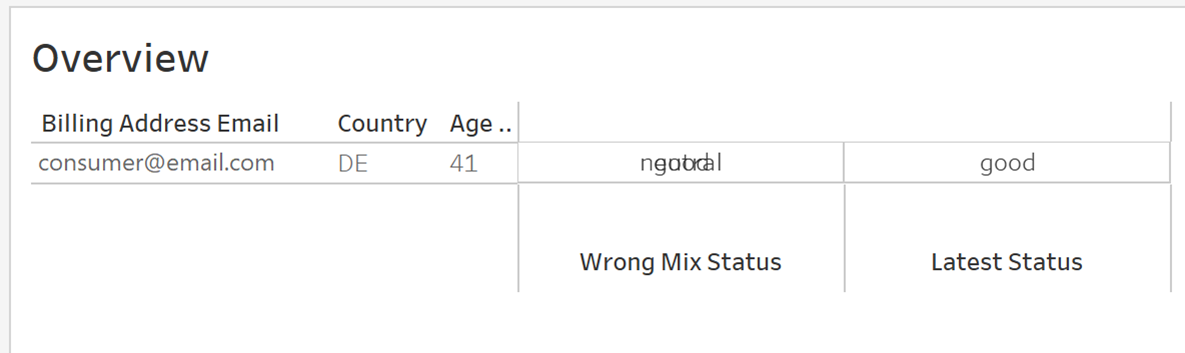
1.) Create a calculated field that returns the latest consumer status. In this example, status is related not to user ID, but to consumer email and only orders with a certain decision (accepted). For date, the Order Created At date field is used.
Name: Consumer Status Latest
IF [Order Created At] = {FIXED [Billing Address Email], [Decision]: MAX([Order Created At] )}
THEN [Consumer Status] END
2.) In case of possible null values, for а certain date or any other additional fields as the Decision field from the example, create a measure placeholder using for example MAX(0) function.
Name: Placeholder
MAX(0)
3.) Place such a placeholder in a column and switch it to Text in Marks. Into Marks place a calculated field created from step 1.

Also, it’s possible to turn the measure into discrete and hide its header.
V. Create a calculated field to return the latest numerical value
- What could it be useful for?
If there are numeric fields in the database that are already aggregated and it is required to return only the last value depending on the last timestamp value.
1.) Create a calculated field that returns the latest value of the paid amount total. In this example, paid amount is again related not to consumer email and for the date as a timestamp the Order Created At date field is used.
Name: Paid Amount Total Latest
SUM(
IF [Order Created At] ={ FIXED [Billing Address Email]:MAX([Order Created At])} THEN [Paid Amount Total]
END)
2.) Place such a calculated field in a column and convert it to a discrete field.
Remember that the calculation will work regardless of the filters used in the worksheet, because of the FIXED function.
VI. Create a calculated field to exclude certain values from view without filtering it
- What could it be useful for?
This approach is useful mainly in the case when some values can’t be excluded from view by filtering because, for example, it will also exclude related dates related.
See the example below. If Accepted volumes are filtered out, then the entire days of 12 and 26 July 23 will be dropped, what might be unwanted. Additionally, Accepted values are zeroed out to correctly calculate the ratio between the remaining sub-categories (Reasons).
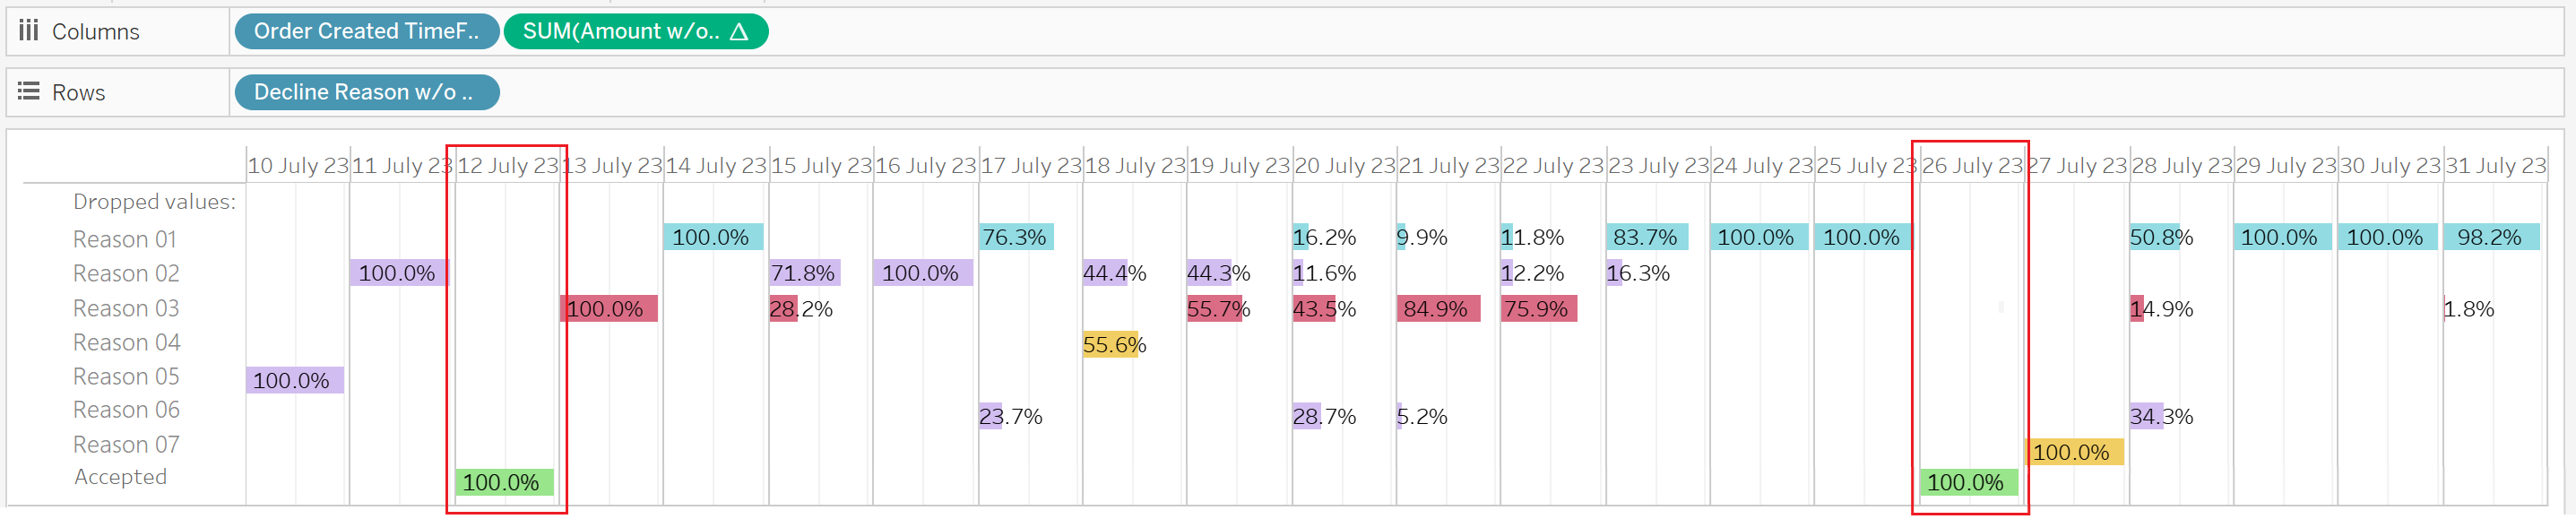
1.) Create a new calculated field as a dimension to mark all values to be deleted as “Dropped values”. Below is an example to exclude all Decline Reason values related to the accepted status.
Name: Decline Reason w/o Accepted
IF [status] = "accepted" THEN "Dropped values"
ELSE [Decline Reason] END
2.) Create a new calculated field as a measure to zero all amounts related to “Dropped values”. Below is an example to exclude all Accepted amounts related to the accepted status.
Name: Amount w/o Accepted
IF [status] = "accepted" THEN 0
ELSE [Amount] END
3.) Place the created dimension in rows and the created measure in columns.
4.) Calculate the ratio between the remaining sub-categories amounts by quick calculation for the created measure field from step 3. Right-click and choose Quick Table Calculation – Percent of Total.
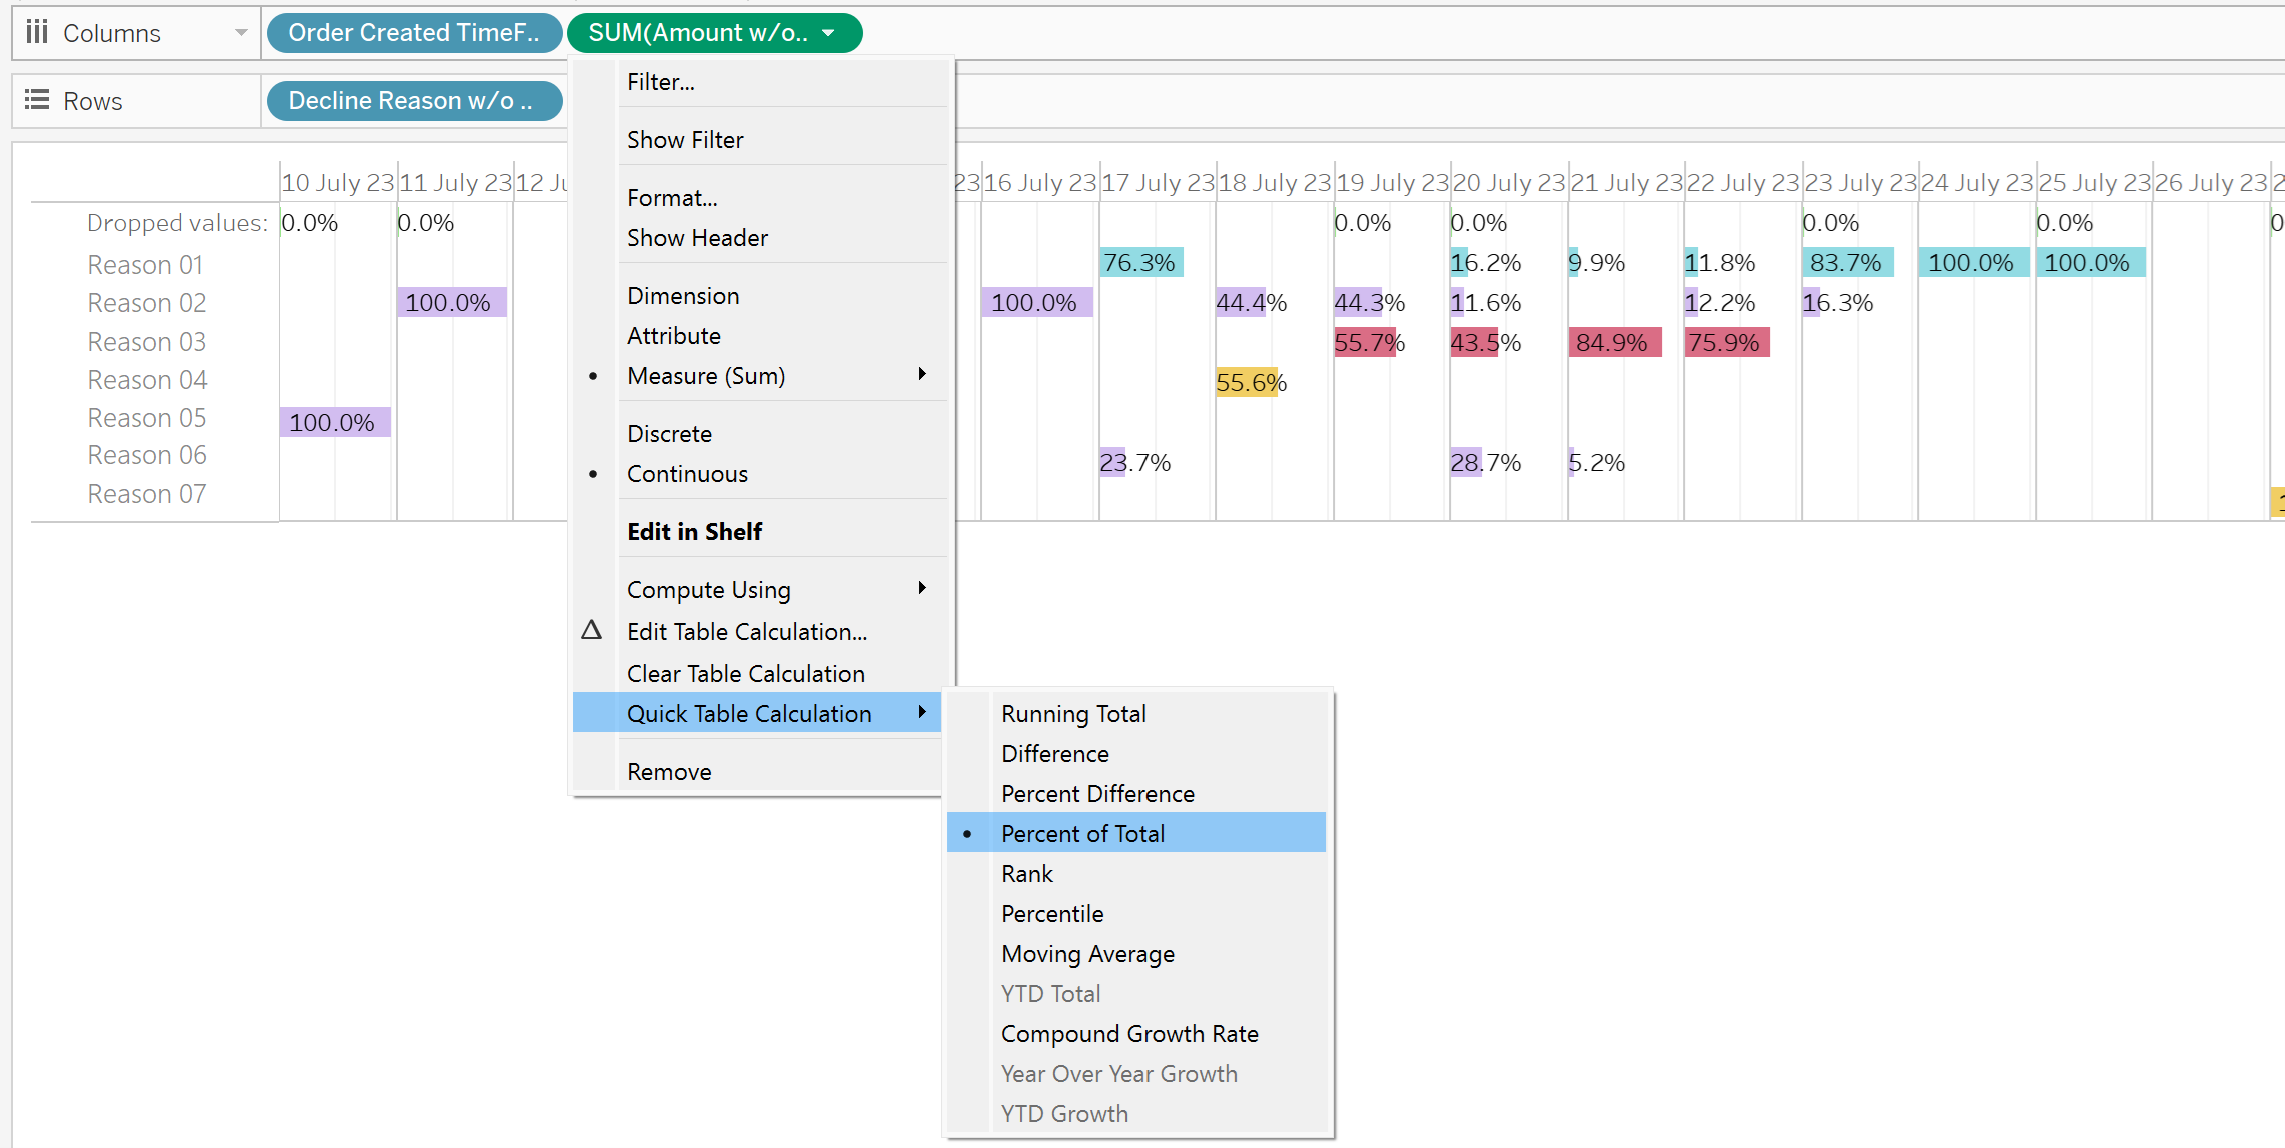
5.) Zero % values for the dropped sub-category can be hidden using the steps described in hint VI. Right-click on the used measure with the quick table calculation and select Format. And for number format choose Custom format then copy paste the next code:
#0.0%; (#0.0" %"); #
As а result, all 0% are gone from the view.

VII. Hiding zero values on charts
- What could it be useful for?
In case there are many zero values on the chart and hiding them makes the chart more readable.
1.) Click on the column in the table that you’d like to format
2.) Choose Custom and then enter ## This would hide the zero values in the tables.
3.) In case you need to do additional formatting as a currency or % as well, apply the formatting that you’d like first by applying them as currency € sign, etc.
4.) And then go into the custom format option, where the formatting that you chose is pre-filled. Just add the “#” at the end after the semi-colon “;”
For currency a custom format might look like this:
# ##0" €"; (# ##0" €"); #
For % ratio a custom format might look like this:
#0.0%; (#0.0" %"); #

Feedback
Thank you for reading and your interest! In case of feedback or questions feel free to reach out via Linkedin.