
RFM (Recency, Frequency, Monetary) table, top customer scoring, scoring segmentation

Introduction
Customer value analysis (CVA) is an analytic method for discovering customers’ characteristics and on this basis making further analysis to extract useful knowledge from big data.
RFM models help us to understand how much is the client worth to the company. This is known as customer scoring. Based on such information, we are able to determine the efficiency of marketing campaigns and decide whether a customer is important enough for us to maintain advertising spendings.
The main advantage of RFM analysis is that it provides meaningful information about customers while using fewer (three-dimensional) criterions as cluster attributes. This reduces the complexity of customer value analysis model without compromising its accuracy.
Data
For current project used online retail dataset from UCI Machine Learning Repository. The libraries used pandas and datetime. The data and full code are available in the repository
I. Create a Recency Frequency Monetary table
• count of unique countries
df = pd.read_excel("online_retail.xlsx")
• countries with the largest number of consumers
customer_country=df[['Country','CustomerID']].drop_duplicates()
print(customer_country.groupby(['Country'])['CustomerID']\
      .agg('count').reset_index().sort_values('CustomerID', ascending=False))
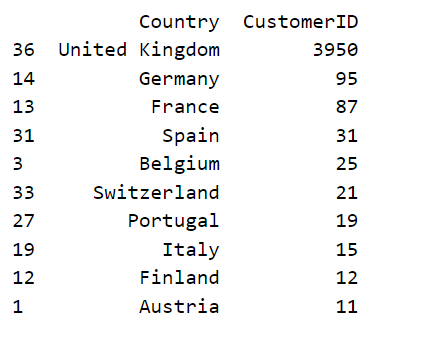
• Since 92% are from UK, let’s limit analysis UK only
df_UK = df.loc[df['Country'] == 'United Kingdom']
• get rid of null values for CustomerID
print(df_UK.isnull().sum(axis=0))
df_UK = df_UK[pd.notnull(df['CustomerID'])]

• minimum values in UnitPrice and Quantity columns
price_min = df_UK.UnitPrice.min()
quantity_min = df_UK.Quantity.min()
• get rid of negative values in Quantity column
df_UK = df_UK[(df_UK['Quantity']>0)]
quantity_min = df_UK.Quantity.min()
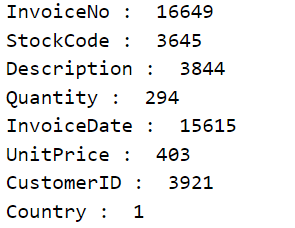
• unique values for each column of df_UK
def unique_counts(df_UK):
   for column in df_UK.columns:
       count = df_UK[column].nunique()
       print(column, ": ", count)

unique_counts(df_UK)
• total price calculation
df_UK['TotalPrice'] = df_UK['Quantity'] * df_UK['UnitPrice']
• first and last order date in the data
FD = df_UK['InvoiceDate'].dt.date.min() # 2010-12-01
LD = df_UK['InvoiceDate'].dt.date.max() # 2011-12-09
• recency calculation
calc_time = LD + dt.timedelta(days=1)
df_UK['InvoiceDate'] = pd.to_datetime(df_UK['InvoiceDate'])
• RFM table
rfm_tab = df_UK.groupby('CustomerID').agg({'InvoiceDate': lambda x: (calc_time - x.dt.date.max()).days, # Recency
                                        'InvoiceNo': lambda x: len(x),    # Frequency
                                        'TotalPrice': lambda x: x.sum()}) # Monetary Value

rfm_tab['InvoiceDate'] = rfm_tab['InvoiceDate'].astype(int)
rfm_tab.rename(columns={'InvoiceDate': 'Recency',
                        'InvoiceNo': 'Frequency',
                        'TotalPrice': 'Monetary_value'}, inplace=True)
• RFM metrics for each customer
rfm_tab.head()

Interpretation:
– CustomerID has such frequency, monetary value and recency that many days
II. Find the best customers
• Split metrics into segments by using quartile (4 segments)
cust_quantiles = rfm_tab.quantile(q=[0.25,0.5,0.75])
cust_quantiles = cust_quantiles.to_dict()
print(cust_quantiles)
• Segmented RFM table
segmented_rfm = rfm_tab
• Functions to categorize customers, 111 is the best score
def RS_score(x,p,d):
    if x <= d[p][0.25]:
        return 1
    elif x <= d[p][0.50]:
        return 2
    elif x <= d[p][0.75]:
        return 3
    else:
        return 4

def FM_score(x,p,d):
    if x <= d[p][0.25]:
        return 4
    elif x <= d[p][0.50]:
        return 3
    elif x <= d[p][0.75]:
        return 2
    else:
        return 1
• Function results and sort out by adding a new column to combine RFM score
segmented_rfm['r_quartile'] = segmented_rfm['Recency'].apply(RS_score,\
                              args=('Recency',cust_quantiles,))
segmented_rfm['f_quartile'] = segmented_rfm['Frequency'].apply(FM_score,\
                              args=('Frequency',cust_quantiles,))
segmented_rfm['m_quartile'] = segmented_rfm['Monetary_value'].apply(FM_score,\
                              args=('Monetary_value',cust_quantiles,))

segmented_rfm['RFM_score'] = segmented_rfm.r_quartile.map(str)\
                            + segmented_rfm.f_quartile.map(str)\
                            + segmented_rfm.m_quartile.map(str)
• top 10 customers by score
top_10_customers = segmented_rfm[segmented_rfm['RFM_score']=='111']\
                   .sort_values('Monetary_value', ascending=False).reset_index()

• top 10 customers only by Monetary_value (TotalPrice)
cust_UK_total = df_UK.groupby('CustomerID')['TotalPrice'].sum()
print(cust_UK_total.sort_values(ascending=False).head(10))
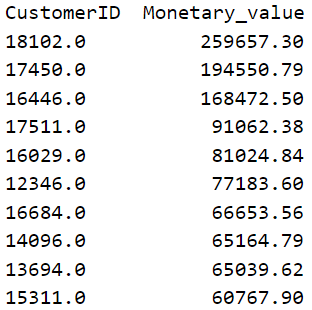
Conclusion:
– As we can see, in this case, the top 2 customers are also the customers with the highest monetary value compared to all