
Conversion rate, daily count of the ads served, count of lost subscribers

Introduction
In this article, we’ll look at an example of analyzing customer behavior in terms of conversion rates on different days of the week. In this case, we’re talking about a specific case where the conversion rate suddenly dropped and we had to determine the cause and calculate the consequences of the error.
Data
For current project used marketing dataset based on the data of an online subscription business. The libraries used are numpy, pandas and matplotlib. The data and full code are available in the repository
I. Identifying inconsistencies
// 1. Step – Check whether users are more likely to convert on weekends compared with weekdays.
• Add day of week column
df = pd.read_csv('marketing_data_2021.csv', parse_dates = ['date_served'])
df['DoW_served'] = df['date_served'].dt.dayofweek
• Function to calculate conversion rate by day of week for each channel
def converstion_rate( df, column_names):
	# group by column_names and calculate subscribers
	subscribers = df[ df['convert_value'] == True].groupby(column_names)['user_id'].nunique()
	# group by column_names and calculate total visitors
	total = df.groupby(column_names)['user_id'].nunique()
	conversion_rate = subscribers/total
	return conversion_rate

DoW_conversion = converstion_rate(df, ['DoW_served', 'marketing_channel'])
• Unstack channels and plot conversion rate by day of week
DoW_df = pd.DataFrame(DoW_conversion.unstack(level=1))
DoW_df.plot()
plt.title('Conversion rate by day of week\n')
plt.ylim(0)
plt.show()
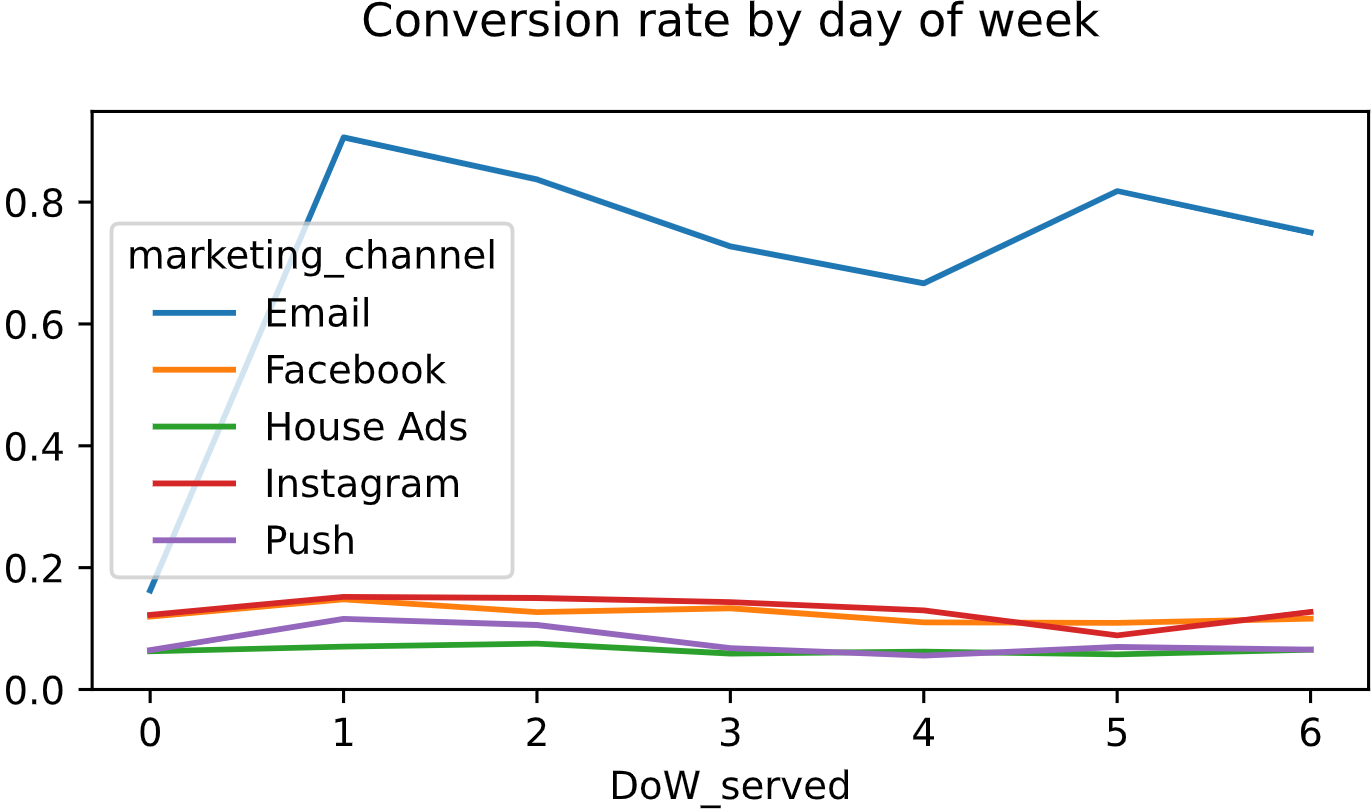
Conclusion:
– ruled out natural fluctuations across the day of the week
– the marketing assets as the cause for decreasing house ads conversion
// 2. Step – Check conversion by language over time, if the new marketing campaign does not apply broadly across different cultures.
• The rows where marketing channel is House Ads
house_ads = df[df['marketing_channel']=='House Ads']
• Conversion by date served, and language displayed
DoW_conversion = converstion_rate(house_ads, ['date_served', 'language_displayed'])
• Unstack DoW_conversion and defining a function for plotting graphs
conv_lang_df = pd.DataFrame(conv_lang_channel.unstack(level=1))
def plotting_conversion(df):
          	for column in df:
                        	plt.plot( df.index, df [column])
                        	plt.title('Daily' + column + 'retention rate\n', size = 16)
                        	plt.ylabel('Retention rate (%)', size = 14)
                        	plt.xlabel('Date', size = 14)
                        	plt.show()
                        	plt.clf()
• Defined plotting function results
plotting_conv(conv_lang_df)
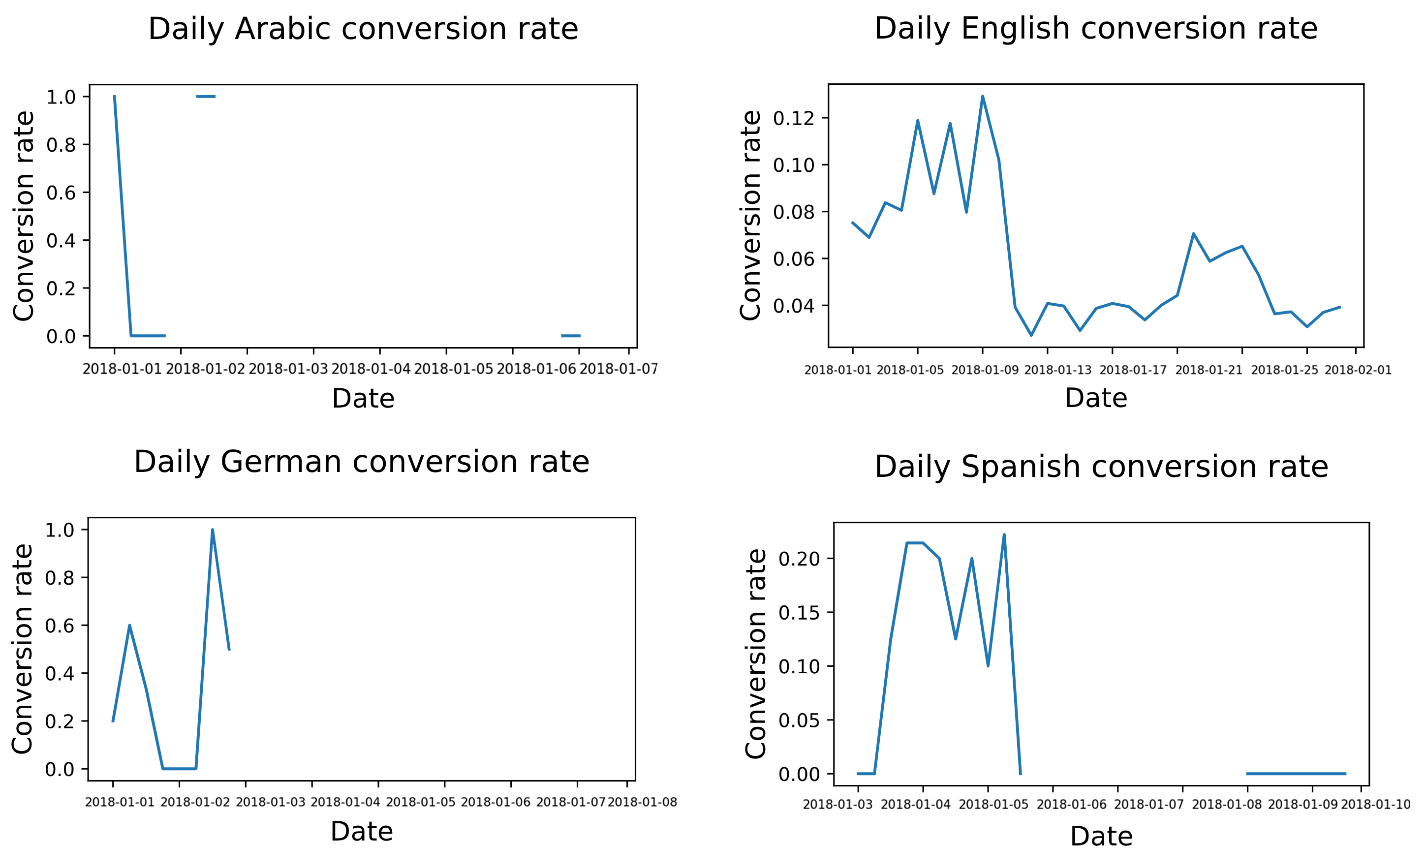
Conclusion:
– the English conversion rate drops around the 11th of Jan, and there do not appear to be ads served in other languages for a two week period. Needs further investigation
– conversion is down because there is a pattern around language preferences
// 3. Step - identify what the problem is specifically so that the team doesn’t repeat their mistake.
• A new column for sorting, showing if the preferred language was shown
house_ads['is_correct_lang'] = np.where(house_ads['language_displayed'] == house_ads['language_preferred'], 'Yes', 'No')
• Group by date_served and is_correct_lang to get a daily count of the ads served
language_check = house_ads.groupby(['date_served', 'is_correct_lang'])['is_correct_lang'].count()
• What percentage of users were not being served ads in the right language
language_check_df = pd.DataFrame(language_check.unstack(level=1)).fillna(0)
language_check_df['pct'] = language_check_df['Yes']/language_check_df.sum(axis=1)
plt.clf()
plt.plot(language_check_df.index.values, language_check_df['pct'])
plt.show()

Conclusion:
– house ads have been underperforming due to serving all ads in English rather than each user’s preferred language
II. Resolving inconsistencies
• Pre-error conversion rate calculation. Assuming bug arose sometime around ‘2021-01-11’
house_ads_no_bug = house_ads[house_ads['date_served'] < '2021-01-11']
lang_conv_before = converstion_rate(house_ads_no_bug, 'language_displayed')
• Index other language conversion rate against English
spanish_index = lang_conv_before['Spanish']/lang_conv_before['English'] # = 1.68
arabic_index = lang_conv_before['Arabic']/lang_conv_before['English'] # = 5.04
german_index = lang_conv_before['German']/lang_conv_before['English'] # = 4.48
• Total number of users and actual conversion on each day
lang_conv_actl = house_ads.groupby(['date_served', 'language_preferred']).agg({'user_id':'nunique', 'convert_value':'sum'})
• Unstack the result, number of users who should have seen ads in each language and how many of those users converted each day
lang_conversion = pd.DataFrame(lang_conv_actl.unstack(level=1))
• English conversion rate column for affected period, retrieve columns only from the period where the language bug was a problem
lang_conversion['epxected_english_rate'] = lang_conversion.loc['2021-01-11':'2021-01-31'][('convert_value', 'English')]
• Expected conversion rates for each language
lang_conversion['epxected_spanish_rate'] = lang_conversion['epxected_english_rate'] * spanish_index
lang_conversion['epxected_arabic_rate'] = lang_conversion['epxected_english_rate'] * arabic_index
lang_conversion['epxected_german_rate'] = lang_conversion['epxected_english_rate'] * german_index
• Daily expected unbugged conversion if the language bug had not occurred
lang_conversion['expected_spanish_conv'] = lang_conversion['epxected_spanish_rate'] * lang_conversion[('user_id', 'Spanish')]/100
lang_conversion['expected_arabic_conv'] = lang_conversion['epxected_arabic_rate'] * lang_conversion[('user_id', 'Arabic')]/100
lang_conversion['expected_german_conv'] = lang_conversion['epxected_german_rate'] * lang_conversion[('user_id', 'German')]/100
• Impact as the number of lost subscribers
bug_period = lang_conversion['2021-01-11':'2021-01-31']

expected_subs = bug_period ['expected_spanish_conv'].sum()\
                + bug_period ['expected_arabic_conv'].sum()\
                + bug_period ['expected_german_conv'].sum()

actual_subs = bug_period[('convert_value', 'Spanish')].sum()\
    		  + bug_period[('convert_value', 'Arabic')].sum()\
              + bug_period[('convert_value', 'German')].sum()

lost_subs = expected_subs - actual_subs # 58.14 - 26 = 32.14
Conclusion:
– 33 subscribers may not seem like many, but for a small company this can be vitally important, especially when expanding to new markets.